2Week 37
2.1 Readings for this week's lectures
Sections 6.8 – 6.11 and 8.5 in the textbook.2.2 Readings for this week's exercises
Sections 6.1 – 6.7 in the textbook.2.3 Notes
Below, you will find some important results from last week's curriculum which might prove useful when you work on this week's problems (further below).Rules for limits
If and , then the following rules apply:
Equality of limits
If two functions and satisfy for close to , but not necessarily at ,
and if one of the limits exist, then:
Derivatives of selected functions
The equation for the tangent to the graph of in the point is given
by the equation
2.4 Exercises
The pupose of this exercise is to illustrate that the tangent is the limit of a secant when .The definition of the derivative is the limit of the Newton quotient
But what does that mean graphically? We can interpret the Newton quotient as the slope of the straight line
through the points
This line is called a secant. We obtain the derivative in when the point comes infinitesimally close to , i.e., the limit .Consider a particular function:
In order to calculate , we can use equation 2.2 with .
Instead of calculating the limit, we can explore the problem graphically for different values of , e.g., by using a calculator or a spreadsheet to calculate the slope of the secant as becomes smaller and smaller.
In the interactive plot below, you can see how the secant changes, as you change by pulling the point along the -axis. At the same time you can see how the value of the slope of the secant (the Newton quotient) also changes.
- Describe what happens as becomes smaller and smaller
- Calculate by using rules for derivatives
- Calculate the value
- Compare the exact value of to the value in the plot for the smallest value of
- The plot has deliberately been made so that you can not set . What would happen if ?
In this exercise we consider the same function as in exercise 2.1.In the graph below you can zoom in on the curve by marking a rectangular area. Try to zoom in on the point .
If you zoom in enough, it will become impossible to distinguish the curve from the tangent (dashed line). This is true
for all differentiable functions, so in other words: locally any differentiable function is indistinguishable from a
straight line (which is identican to the tangent when you have zoomed and infinite amount).To go back and start over, simply double click anywhere in the graph.
a) Find the slope of the curve at the point .
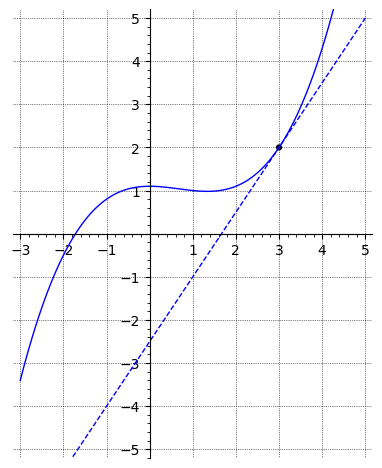

b) Where does the curve have a slope of zero?
and
and
A function and its derivative have the particular values
What is the equation for the tangent to the graph at the point shown in the figure below?
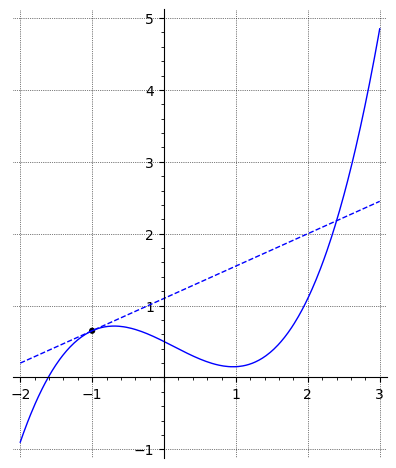

The tangent to the graph for the function at the point is given by the equation
What are the values of and ?
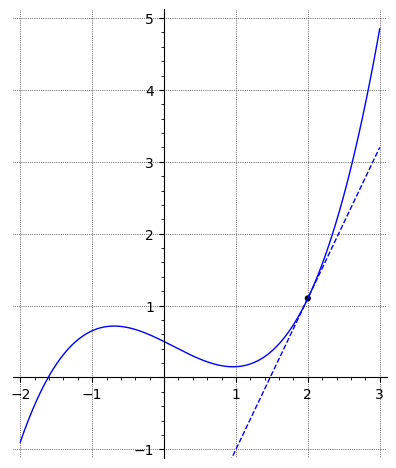

The plot below shows the graph for a function
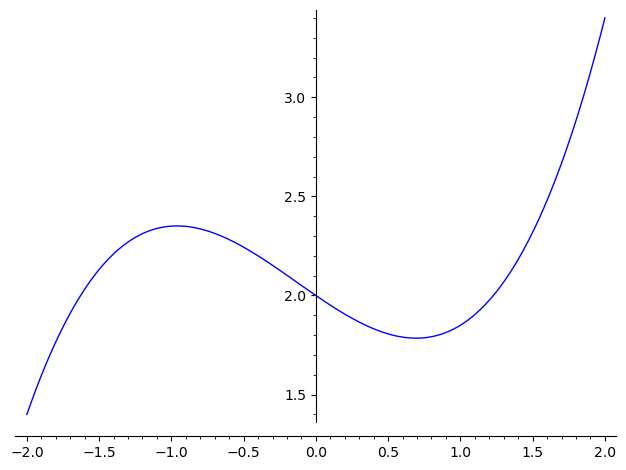
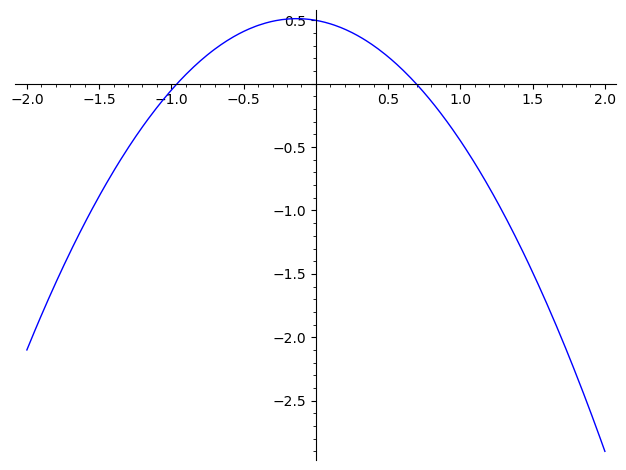
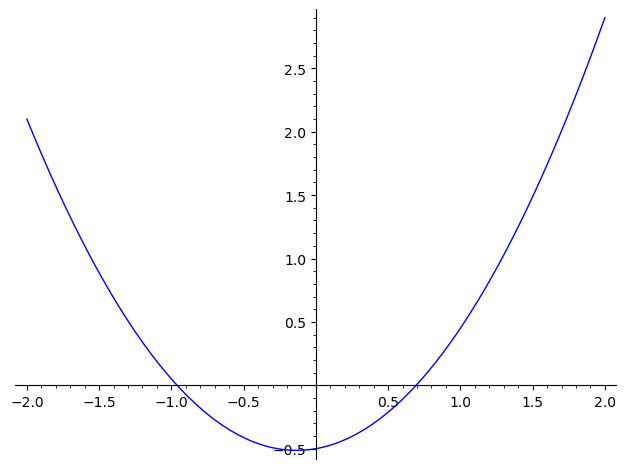
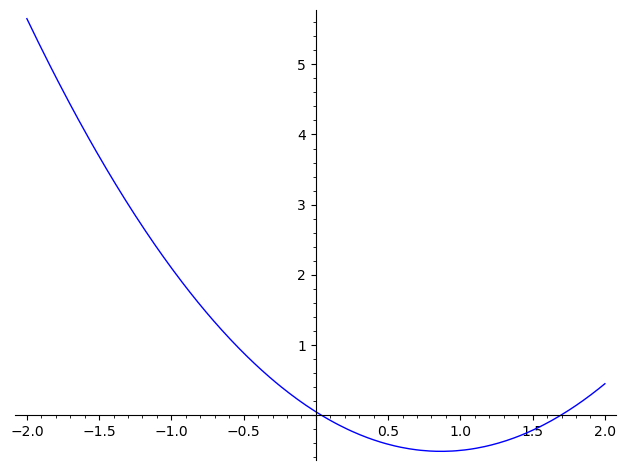
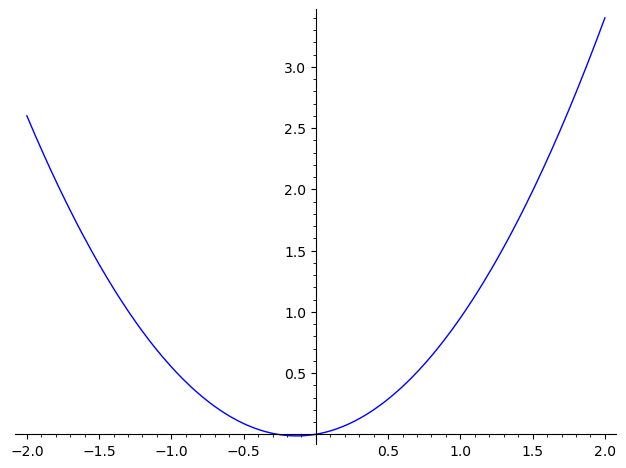

Which of the following graphs shows a plot of the derivative of ?


The figure below shows the graphs for a function (solid blue) and its derivative (dashed red).
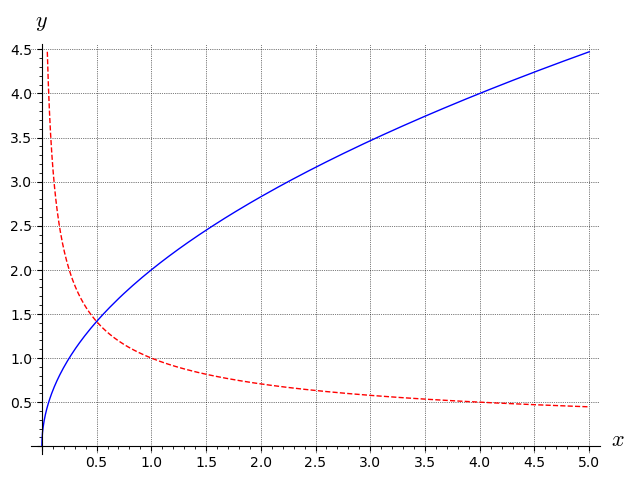 Find the equation for the tangent to for .

What are the values of and ?
Use equation 2.1.
Find the limits below.
Calculate the limit
Are you sure you don't want to think about it first? Use hints only when you need them!Yes, I'm stuck. Show me the hint!
Calculate the derivatives of the following functions:
Calculate the derivatives of the following functions:
- , where is a constant.
- .
- , where , and are constants.
- , where .
- .
Calculate when is given by:
Calculate the derivative of the following functions:
Use the product rule for derivatives here. It is often a good idea to begin by writing up the four functions
and that are part of the final expression. In problem 1, below, the first function
can be chosen as and the second function as . The derivatives of these are and
, respectively.
Calculate the derivatives of the following expressions: